
Now comes a press release from the Potsdam Institute for Climate Impact Research:
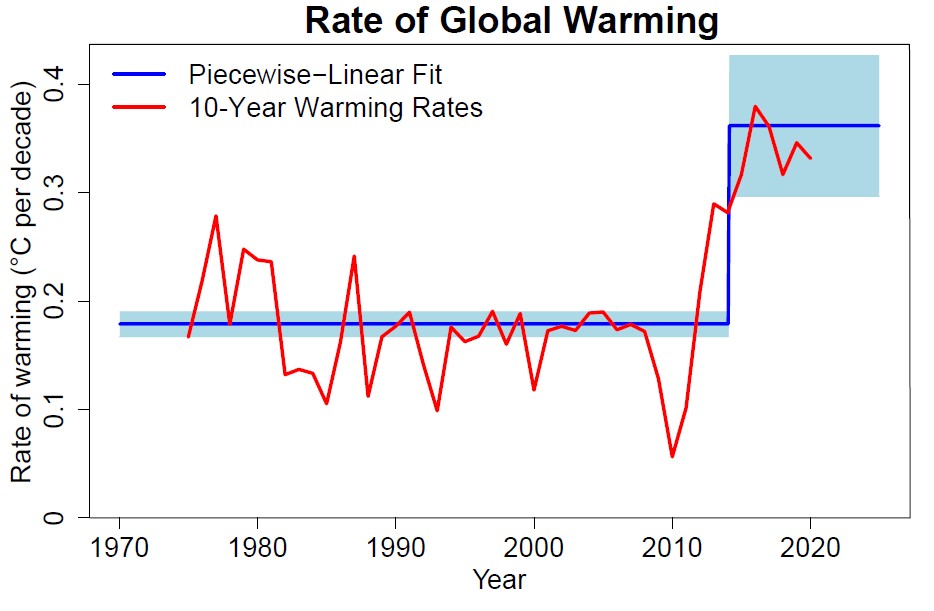
Global warming rate (in °C per decade) from the Berkeley Earth global temperature data: The blue line shows the linear trends for the time before and after 2015 (light blue the uncertainty range). The red line shows the linear trend for 10‐year windows of the data, at 1-year intervals. Figure: PIK
https://agupubs.onlinelibrary.wiley.com/doi/abs/10.1029/2025GL118804
˜˜˜˜˜


